
Amsterdam Utility Costs 2026 - What's Included in Serviced Apartments | City Retreat
James Evans • Sun, Feb 8, 2026
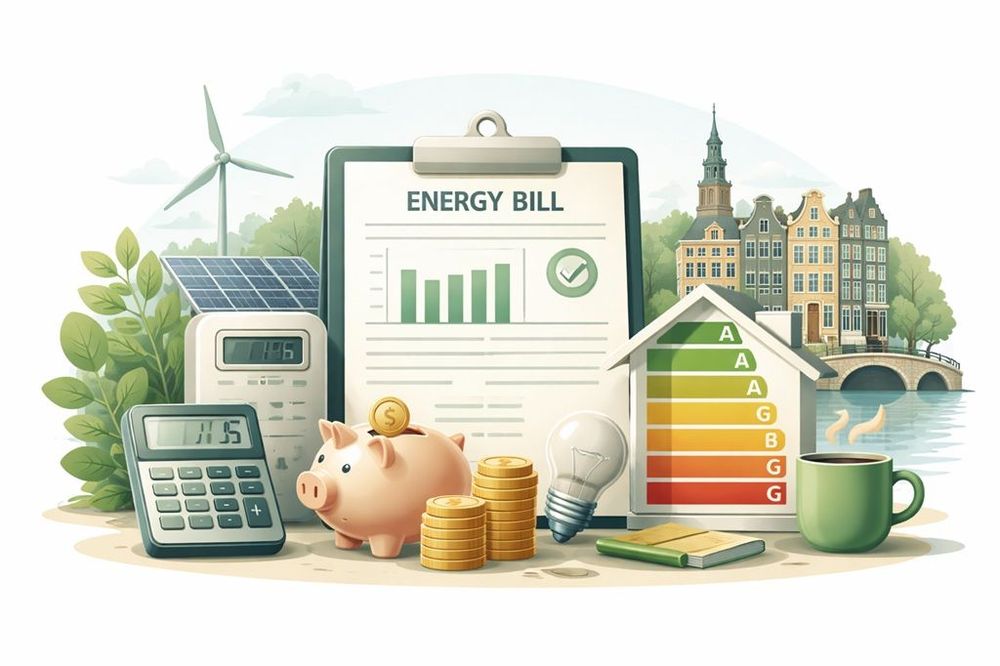
Gas, electricity, water, and internet costs for Amsterdam households — with live 2026 prices, consumption benchmarks by household size, provider recommendations, and practical tips for keeping your bills under control.
What to Budget for Amsterdam Utilities in 2026
Gas, electricity, water, and internet are the four utility costs every Amsterdam household pays. Together — for a typical one-bedroom apartment with two occupants — they come to somewhere between €180 and €350 per month, depending heavily on apartment size, energy label, gas usage, and the type of energy contract you're on.
2026 has been a volatile year for energy costs. Gas prices fell sharply through late 2025 before spiking dramatically in March 2026 — up around 80% on the wholesale market — following escalating Middle East conflict and disruption to LNG supply from Qatar. Households on variable contracts were hit with a 21% price rise from 1 April 2026. Those on fixed contracts are insulated for now, which makes locking in a fixed-rate deal the single most effective thing you can do right now.
Gas prices surged ~80% on European wholesale markets in early March 2026 due to conflict around the Strait of Hormuz and Qatar LNG production halts. Variable contract holders saw gas bills rise by an average of 21% from 1 April. The current consumer gas price on new fixed contracts ranges from €1.39–€1.53/m³ — significantly above the early-year forecast of €1.15–€1.24/m³. Electricity prices are more stable at €0.25–€0.32/kWh on new fixed contracts. If you're on a variable or dynamic contract, switching to a fixed deal now is worth serious consideration. Sources: Keuze.nl, Consumentenbond
The good news for anyone in serviced apartments in Amsterdam or expat rentals Amsterdam with all-inclusive contracts: none of this affects you directly. All City Retreat apartments include all utilities in one fixed monthly figure — no energy contracts to arrange, no April bill shocks, no annual reconciliations. For everyone managing their own utility accounts, read on.
How Dutch Energy Billing Actually Works
If you're arriving from the UK, US, or most other countries, the Dutch billing system will be unfamiliar. Understanding it upfront saves a lot of confusion — and a nasty surprise in April.
Dutch energy providers don't charge you for exactly what you use each month. Instead, they estimate your annual consumption based on your address and household size, divide the total by 12, and charge you a fixed monthly advance payment (voorschot or termijnbedrag). Once a year — typically in spring — they do a reconciliation (jaarafrekening) comparing your actual meter readings with their estimate. Use less than expected: you get money back. Use more: you pay the difference.
The moment you get your keys, find the meter cupboard (meterkast) — usually in the hallway — and photograph the gas, electricity, and water meter readings. Send these to your energy supplier immediately. If you don't, you may end up paying for the previous tenant's usage. This is one of the most common and most avoidable billing disputes in Dutch rentals.
Your energy bill has three components, only one of which you can influence by choosing a provider:
| Component | What It Is | Can You Choose? |
|---|---|---|
| Supply costs (leveringskosten) | The actual cost of gas/electricity — your variable usage cost plus a fixed admin fee | Yes — this varies by provider |
| Network costs (netbeheerkosten) | Cost of transporting energy to your home, managed by the regional grid operator (Liander in Amsterdam). ~€38/mo electricity, €15–30/mo gas | No — fixed regardless of provider |
| Energy tax (energiebelasting) | Government tax per kWh and m³ consumed. In 2026: €0.11/kWh electricity, €0.73/m³ gas (inc. VAT). A tax credit of €628.96/yr is applied to electricity bills | No — set by government annually |
The practical upshot: when comparing providers, look at the total monthly cost for your expected consumption — not just the per-unit tariff. Welcome bonuses and cashbacks (currently up to €466 with some providers) can make a significant difference in year one.
Gas Costs in Amsterdam Live April 2026
Gas in Amsterdam is primarily used for central heating, hot water, and cooking. Your gas consumption depends much more on the type of property you live in than on the number of occupants — a well-insulated flat uses dramatically less gas than an older terraced house, regardless of how many people are inside.
Average Monthly Gas Costs by Property Type
| Property Type | Typical Annual Use | Est. Monthly Cost (at €1.47/m³) |
|---|---|---|
| Modern flat / apartment | ~1,000–1,200 m³ | €122–€147 |
| Older Amsterdam canal house (flat) | ~1,200–1,800 m³ | €147–€221 |
| Terraced house | ~1,500–2,000 m³ | €184–€245 |
| Semi-detached house | ~2,000–2,500 m³ | €245–€306 |
| Detached house | ~2,500–3,500 m³ | €306–€429 |
| All-electric home (no gas) | Zero | €0 |
Calculations based on €1.47/m³ average fixed contract price (April 2026, Overstappen.nl). Amsterdam average annual gas consumption: ~1,208 m³ per household. Source: CBS, Energie-Nederland.
The Netherlands has some of the highest gas taxes in Europe — energy tax in 2026 is €0.73/m³ including VAT. This is deliberate government policy to accelerate the transition away from gas. Combined with current market conditions (Middle East conflict pushing wholesale prices to ~€54/MWh), the consumer price has risen sharply. Households with good insulation and newer boilers fare noticeably better — energy label A or B properties can use 30–50% less gas than older equivalents.
Electricity Costs in Amsterdam Live April 2026
Unlike gas consumption, electricity use scales primarily with the number of people in the household and the appliances used — not the property type. The Netherlands has one of the highest electricity tax rates in Europe, though a tax credit of €628.96 per electricity connection per year (2026) provides some offset.
Average Monthly Electricity Costs by Household Size
| Household Size | Typical Annual Use | Est. Monthly Cost (at €0.28/kWh) | After Tax Credit |
|---|---|---|---|
| 1 person | ~1,500–1,800 kWh | €35–€42 | ~€10–€17/mo after credit |
| 2 people | ~2,500–2,800 kWh | €58–€65 | ~€33–€42/mo after credit |
| 3 people | ~3,000–3,400 kWh | €70–€79 | ~€45–€54/mo after credit |
| 4 people | ~3,400–4,000 kWh | €79–€93 | ~€54–€70/mo after credit |
| 5+ people | ~4,000–5,000 kWh | €93–€117 | ~€70–€91/mo after credit |
Tax credit of €628.96/yr (2026) applied to electricity bill. Calculations at €0.28/kWh (mid-range fixed contract, April 2026). Source: CBS, Nibud, Overstappen.nl.
Of your total electricity rate of ~€0.28/kWh: roughly €0.11 is energy tax, ~€0.05 is network costs, and ~€0.12 is supply cost. The energy tax rate was reduced slightly in 2026 (from €0.1228 to €0.1105/kWh) — a small saving offset by rising supply costs. Amsterdam's grid operator is Liander. Network costs (~€38/month) are the same regardless of which supplier you choose.
Seasonal Variation: The January Bill Shock
This catches a surprising number of expats off guard. Because Dutch providers charge a fixed monthly advance based on annual averages, your invoice stays constant month to month — but your actual consumption doesn't. In a cold Dutch winter, you'll use far more gas than in summer, and the annual reconciliation will catch up with you.
For those on variable or dynamic contracts — or anyone paying actual consumption each month — the seasonal swings are immediate and significant:
Gas use drops sharply — heating off, less hot water needed. Electricity fairly steady. Most manageable months for energy costs.
Gas heating runs constantly in older properties. Bills can triple from summer levels, especially in poorly insulated canal houses. Plan for this in your budget before October.
For expats in temporary accommodation in Amsterdam or monthly accommodation Amsterdam, the simplest way to avoid seasonal bill volatility is an all-inclusive serviced apartment. City Retreat apartments include all gas, electricity, and water in a single fixed monthly rate — no winter surprises, no annual reconciliations, no energy contracts to set up. Browse available apartments →
Water Costs in Amsterdam: Waternet
Unlike energy, you cannot choose your water supplier in Amsterdam — it is a regional monopoly. Waternet supplies all households in Amsterdam and the surrounding area. The good news is that Amsterdam water is excellent quality (genuinely drinkable straight from the tap, which many arriving expats don't realise), and costs are among the lower utility bills you'll pay.
Waternet Tariffs 2026
| Cost Component | 2025 Rate | 2026 Rate | Change |
|---|---|---|---|
| Variable rate (per m³) | €1.22/m³ | €1.18/m³ | ▼ Down |
| Fixed annual charge | €98.42/yr | €90.55/yr | ▼ Down |
Note: Waternet rates are quoted excluding 9% VAT and the annual water tax (belasting op leidingwater). Add ~9% to the totals above for the full amount. Source: Waternet.nl
Average Monthly Water Costs by Household Size
| Household | Annual Use (approx.) | Est. Monthly Cost (incl. fixed charge) |
|---|---|---|
| 1 person | ~55 m³ | ~€13/mo |
| 2 people | ~90 m³ | ~€16/mo |
| 3 people | ~130 m³ | ~€20/mo |
| 4 people | ~165 m³ | ~€24/mo |
| 5 people | ~200 m³ | ~€28/mo |
Based on average Dutch consumption of ~119 litres/person/day (CBS/Vewin 2024). Costs include fixed annual charge spread monthly. Excludes water authority tax (waterschapsbelasting) billed separately by Waternet. Source: CBS, Vewin, Waternet.nl
Some Amsterdam properties — particularly older ones — don't have individual water meters. In this case, Waternet charges a flat-rate estimate based on property type. If your property does have a meter, you'll be asked to submit readings periodically and reconciled annually. Check with your landlord whether a water meter is installed, and whether the cost is included in your rent or paid directly.
Internet Costs in Amsterdam
The Netherlands has some of the fastest and most reliable internet infrastructure in Europe — Amsterdam is consistently among the top-ranked cities for broadband speed, with fibre connections reaching up to 8 Gbps. For most households, a standard 300 Mbps package is more than sufficient for remote working, streaming, and video calls simultaneously.
Budget for €32–€65 per month for internet in Amsterdam. The main providers are KPN (fibre, dominant in Amsterdam with ~37% market share) and Ziggo (cable, ~36% market share). For most Amsterdam addresses, both are available — run a postcode check on each provider's website to confirm.
| Provider | Technology | Speed | Monthly Cost | Best For |
|---|---|---|---|---|
| KPN | Fibre | Up to 1 Gbps | €42.50–€65/mo | Reliability, 5G mobile bundling |
| Ziggo | Cable | Up to 1 Gbps | €39.50–€65/mo | TV bundles, quick setup |
| Odido | Fibre / DSL | Up to 1 Gbps | €35–€55/mo | Flexible contracts |
| Youfone | DSL / Fibre | Up to 500 Mbps | €32–€45/mo | Budget option |
Most Dutch internet contracts run for a minimum of 12 months. If you're in Amsterdam for less than a year, check the cancellation terms before signing — some providers charge a fee for early termination. For short-term rental Amsterdam stays, it may be worth paying slightly more for a rolling monthly contract or using your mobile as a hotspot until you're settled. City Retreat apartments include high-speed Wi-Fi in the monthly rate — no contracts, no installation waiting times.
Use Overstappen.nl or Independer to compare live internet deals by postcode. Both are available in English and cover all major providers.
Energy Providers in Amsterdam: Who to Consider
The Dutch energy market is fully liberalised — you can choose from over 20 providers for gas and electricity. In Amsterdam, the grid is managed by Liander (for both gas and electricity), but your supply contract can be with any national provider. Prices between providers on the same contract type can vary by €300+ per year for the same consumption, so comparing before signing is worth the 10 minutes it takes.
Largest provider in Amsterdam (formerly Nuon). Reliable, established, currently offering competitive welcome bonuses. Well-regarded for service quality. Swedish state-owned with strong sustainability credentials.
vattenfall.nl →Fully English website, trusted Coolblue brand, competitive fixed rates (~€0.241/kWh electricity, ~€1.259/m³ gas on recent data). Excellent customer service reputation. Good starting point for anyone new to the Netherlands.
coolblue.nl/energie →Strong focus on green energy and smart home integration. Good English support. Popular with expats who want predictable fixed rates and sustainability credentials. Useful if you have an electric vehicle.
eneco.nl →Named most customer-friendly energy provider in the Netherlands every year since 2017. 100% renewable energy. Good English support. Worth comparing for households prioritising sustainability alongside price.
greenchoice.nl →One of the Netherlands' largest suppliers. Broad range of contract options. Variable rates were raised 12.5% from April 2026 for new customers (existing customers protected). Check current fixed rates via comparison tool.
essent.nl →Frequently tops price comparison tables on supply tariff alone. Dutch-language interface. Worth considering if you're comfortable navigating Dutch and want the lowest possible tariff — check total costs including fixed charges.
budgetthuis.nl →The cheapest per-m³ gas price doesn't always mean the cheapest overall bill. Fixed monthly charges, welcome bonuses, and network cost calculation methods all vary. Use Independer or Overstappen.nl (both available in English) to compare total annual costs based on your actual consumption. With current welcome bonuses reaching up to €466, switching is often worthwhile even mid-year.
Need Help Setting Up Gas & Electricity in Amsterdam?
Navigating Dutch energy contracts as a new arrival — often entirely in Dutch — is one of the more frustrating parts of moving to Amsterdam. City Retreat can handle the comparison and setup process for you, making sure the right contract is in place from day one.
Practical Ways to Reduce Your Amsterdam Energy Bills
With gas prices at multi-year highs as of April 2026, reducing consumption pays off more than usual. These aren't complicated — most are free or near-free behavioural changes, with a few worth spending a small amount on if you're staying longer term.
Switch to a Fixed Contract
With gas prices elevated and volatile, a fixed 1-year contract provides both price certainty and often a lower rate than variable. Switch via Independer or Overstappen — takes under 10 minutes.
Save up to €300–€600/yrLower the Thermostat by 1°C
Every degree lower saves roughly 6–7% on heating costs. Dutch habit is typically 19–20°C inside. Dropping from 21°C to 19°C saves meaningfully over a full winter with current gas prices.
Save ~€50–€100/yrShorter Showers
A third of household water — and significant gas for heating — goes on showering. Cutting average shower time from 9 minutes to 5 minutes saves both water and gas.
Save ~€30–€60/yrLED Lighting Throughout
If the apartment has non-LED bulbs, replacing them costs €2–4 each and reduces lighting electricity use by up to 80%. Cheap, permanent, zero ongoing effort.
Save ~€30–€50/yrUnplug Standby Devices
Standby power (TVs, chargers, monitors left on) accounts for roughly 5–10% of electricity consumption. Power strips with switches make this easy to manage.
Save ~€20–€40/yrCold Wash Laundry
Washing at 30°C instead of 60°C cuts the energy used per cycle by around 40%. Most modern detergents work perfectly well at lower temperatures.
Save ~€20–€35/yrMonitor Your Smart Meter
Nearly all Amsterdam homes now have smart meters. Log into your supplier's app or portal to track actual consumption versus your monthly advance. Catch overpaying before the annual reconciliation hits.
Avoid reconciliation surprisesSkip the Bottled Water
Amsterdam tap water is excellent quality — certified clean, well-filtered, and genuinely good to drink. Stopping bottled water saves €20–40/month depending on consumption, with zero compromise on quality.
Save €20–€40/moComplete Utility Budget: Amsterdam Apartment 2026
Putting it all together — here is a realistic monthly utility budget for a typical Amsterdam apartment in April 2026, across three household sizes. These figures assume a gas-heated property on a fixed energy contract, and are based on annualised consumption averaged monthly.
| Utility | 1 Person (Studio) | 2 People (1-Bed) | 3–4 People (2-Bed) |
|---|---|---|---|
| Gas | ~€100–€130 | ~€130–€175 | ~€160–€250 |
| Electricity | ~€20–€30 | ~€35–€55 | ~€55–€80 |
| Water | ~€13–€15 | ~€16–€20 | ~€20–€28 |
| Internet | ~€35–€50 | ~€40–€55 | ~€45–€65 |
| Total | ~€170–€225 | ~€220–€305 | ~€280–€420 |
Electricity figures shown after annual tax credit offset. Gas based on typical Amsterdam flat consumption at April 2026 fixed contract rates. Summer months will be significantly lower (gas near zero). Older, poorly insulated properties will be higher.
All City Retreat serviced apartments Amsterdam include gas, electricity, water, and high-speed Wi-Fi in a single all-inclusive monthly rate. No provider selection, no installation, no monthly advances, no annual reconciliation, and no exposure to April 2026-style gas price spikes. For anyone on expat rentals Amsterdam or temporary accommodation Amsterdam, it removes one of the most time-consuming parts of setting up a new home.
Frequently Asked Questions
For a one-bedroom apartment with two occupants in April 2026, expect roughly €220–€305/month for gas, electricity, water, and internet combined. Gas is the largest variable — older, poorly insulated properties will be at the high end. Summer months run significantly lower (roughly €120–€180) because heating is off. Winter months in a gas-heated property can reach €350–€450.
As of April 2026, the average consumer gas price on new fixed contracts is approximately €1.47/m³ (all-in including taxes and VAT). This is significantly above the early-2026 forecast of €1.15–€1.24/m³ due to Middle East conflict pushing wholesale prices higher. Variable contract holders saw a 21% increase from 1 April 2026. Fixed contract holders are protected at their agreed rate. Source: Keuze.nl, Overstappen.nl (updated 2 April 2026).
New fixed contracts in April 2026 are priced at €0.25–€0.32/kWh. Electricity prices are more stable than gas — the Middle East situation has pushed gas up more sharply. A tax credit of €628.96/year (applied to your electricity bill) significantly reduces the effective rate, particularly for single-person households. Source: Energievergelijk.nl, CBS.
Not with City Retreat. All City Retreat apartments include gas, electricity, water, and Wi-Fi in the monthly rate — nothing to arrange on arrival. For long-term unfurnished rentals in Amsterdam, you will need to arrange your own energy and internet contracts. See our Amsterdam utility setup service if you need help with this.
For expats prioritising English-language support and a reliable fixed-rate contract, Coolblue Energie and Eneco are the strongest options. Vattenfall is the largest Amsterdam provider and worth comparing. For the lowest possible price, use Independer or Overstappen.nl to compare all providers on total annual cost including fixed charges and any welcome bonuses — the cheapest deal changes regularly.
You pay a fixed monthly advance (voorschot) based on estimated annual usage. Once a year (typically spring), your provider compares your actual meter readings with the estimate. If you used less than predicted, you receive a refund. If you used more, you pay the difference. The advance for the next year is then recalculated. This is why photographing your meter on move-in day is so important — you want to ensure you're only being reconciled against your own consumption, not the previous tenant's.
Yes — Amsterdam tap water is excellent quality and completely safe to drink. It is filtered from dune water sources and consistently rated among the best in Europe. There is absolutely no need to buy bottled water. Stopping bottled water consumption saves €20–€40/month for most households and eliminates a significant amount of single-use plastic waste.
In April 2026, a fixed 1-year contract is almost certainly the better choice. Gas prices are elevated and volatile due to Middle East geopolitical tensions, and variable contract holders just absorbed a 21% increase. A fixed contract locks in your rate for 12 months regardless of market movements. The 1-year term (rather than 3-year) is advisable because prices may fall once the geopolitical situation stabilises — you don't want to lock in current elevated rates for 3 years.
Skip the Utility Headache Entirely
All City Retreat serviced apartments include gas, electricity, water, and Wi-Fi in one fixed monthly rate. No contracts, no winter bill surprises, no April 2026 gas spikes. Browse available apartments across Amsterdam.
View Available Apartments